Social Media KPIs for Lead Generation: Which Metrics Matter
The key social media metrics for lead campaigns on Meta, Instagram, TikTok and LinkedIn: from reach and CTR to cost per lead, cost per acquisition and ROAS.
 Valentin Zetter7 min read
Likes, reach, clicks, leads, ROAS – ad platforms give you dozens of metrics, and each one tells a slightly different story. This guide is for performance marketers, agencies and businesses that generate leads through Meta, Instagram, TikTok or LinkedIn. Afterwards you'll know which social media KPIs really matter, how they build on each other, which metric fits which campaign goal and which mistakes cost you budget.
The four levels of metrics
Social media metrics can be sorted into four levels along the funnel. The further down a metric sits, the closer it is to revenue – and the later it becomes available.
1. Awareness: who sees your ad?
- Reach: how many different people saw your ad.
- Impressions: how often it was shown in total.
- Frequency: how often one person saw it on average.
- CPM: what 1,000 impressions cost.
2. Engagement: does anyone respond?
- Engagement rate: the share of interactions such as likes, comments and shares.
- Click-through rate (CTR): the share of impressions that lead to a click.
- Cost per click (CPC): what a click costs.
3. Conversion: does it become an inquiry?
- Conversion rate: the share of clicks that turn into a lead.
- Cost per lead (CPL): what an inquiry costs.
- Lead value: how much revenue a lead brings in on average.
4. Business: are you making money?
- Cost per acquisition (CPA): what a paying customer costs.
- ROAS: how much revenue every ad dollar brings in.
- Customer lifetime value: how much a customer is worth over the entire relationship.
Every ad platform reports the first two levels. From level three on, it gets harder: the platform sees the form submission, but not whether the lead becomes a customer. For that you need data from your CRM or payment system.
How the metrics build on each other
Each metric describes the step from one stage to the next. Only together do they give you the full picture – and show you exactly where a campaign is falling short.
Example: $3,000 monthly ad budget
- Impressions250,000
- Clicks3,750
- Leads150
- Customers15
- Revenue$12,000
An example with a $3,000 monthly budget for a Meta campaign:
Impressions  = 250,000         → CPM = $3,000 ÷ 250,000 × 1,000 = $12
Clicks       = 3,750           → CTR = 1.5%, CPC = $0.80
Leads        = 150             → conversion rate = 4%, CPL = $20
Customers    = 15              → close rate = 10%, CPA = $200
Revenue      = $12,000         → ROAS = $12,000 ÷ $3,000 = 4
The chain shows how each lever works. If click-through rate rises from 1.5% to 2%, you get 5,000 instead of 3,750 clicks at the same CPM – and, at the same conversion rate, 200 instead of 150 leads. If the close rate drops from 10% to 5%, on the other hand, ROAS halves to 2, even though everything in the ad account looks the same.
That's exactly why optimizing a single metric isn't enough. A CPL of $20 is only good if those leads actually become customers. If 150 leads at $20 each don't produce a single deal, the cheap CPL is worthless – and a campaign with a $60 CPL and a solid close rate is the better choice.
Vanity metrics vs. business metrics
Vanity metrics are numbers that look good but can't support a business decision: likes, followers, video views, impressions. They aren't useless – they tell you whether a creative resonates or whether you're buying enough reach. But they don't belong at the center of your reporting.
A simple test: Would you move budget if this number doubled? If engagement rate doubles, probably not. If CPA halves or ROAS doubles, immediately.
| Metric | Type | What it's good for |
|---|---|---|
| Reach, impressions | Vanity / diagnostic | Checking visibility and audience size |
| Engagement rate | Vanity / diagnostic | Comparing creatives |
| CTR, CPC | Diagnostic | Evaluating ad and offer |
| Cost per lead, conversion rate | Early indicator | Evaluating landing page and form |
| CPA, ROAS, customer lifetime value | Business | Allocating budget and scaling |
Which metric for which campaign goal
Not every campaign is meant to deliver leads right away. The right metric depends on the goal:
- Awareness (e.g. new audience, new product): reach, frequency and CPM. Make sure frequency doesn't climb so high that click-through rate collapses.
- Traffic and engagement (e.g. content, video views): CTR, CPC and engagement rate – plus, as a check, whether those visitors later turn into leads through retargeting campaigns.
- Leads (forms, lead ads, booked calls): cost per lead and conversion rate in the short term, share of qualified leads (MQL or SQL) in the medium term.
- Revenue (deals, payments): CPA and ROAS, plus customer lifetime value for subscriptions or repeat purchases.
On LinkedIn you often pay more for impressions and clicks than on Meta or TikTok – in exchange, you reach decision-makers directly. Comparing click prices across platforms is therefore misleading. Compare platforms at the level where they can really be measured: cost per acquisition and ROAS.
Common mistakes with social media KPIs
- Optimizing for likes: An ad that entertains doesn't automatically bring in leads. Judge creatives by leads and deals, not by reactions.
- Taking platform conversions at face value: Meta, TikTok and LinkedIn attribute conversions by their own rules – sometimes even when someone only saw an ad (view-through conversion). The numbers in the ad account are a signal, not your books.
- Double counting across platforms: If a lead first sees a TikTok ad and later clicks on Meta, both platforms claim the conversion. Added up, you have more leads than actually arrive in your CRM.
- Only measuring up to the lead: Without CRM data, you don't know which campaign brings customers and which only brings form fillers.
- Judging too early: With long sales cycles, the ROAS of fresh campaigns inevitably looks bad. Evaluate leads by the month in which they came in.
- Adding up reach across days: Daily reach can't be summed, because the same people are counted multiple times.
Your KPI set in five steps
Set the goal
Define one main goal per campaign: awareness, leads or revenue. That determines the metric you judge it by.Work backwards to targets
Start with revenue: customer value and margin give you a maximum CPA, and your close rate gives you a maximum cost per lead. In the example above, a CPA of $200 at a 10% close rate allows a CPL of no more than $20.Close the tracking gap to the deal
Make sure every lead carries its source, campaign and ad – with clean UTM parameters and click IDs – and that deals and payments are matched to that lead.Read metrics together
Check early indicators such as CTR and CPL weekly, and business metrics such as CPA and ROAS once there are enough deals. Find the stage of the funnel where the campaign drops off.Send results back
Send leads and deals with their value to the platforms via the Conversion API so the algorithm optimizes for buyers instead of as many form submissions as possible.
Keeping track with LeadMetrics
The metrics of the first two levels live in four different ad accounts, the ones further down in your CRM and payment system. LeadMetrics brings them together:
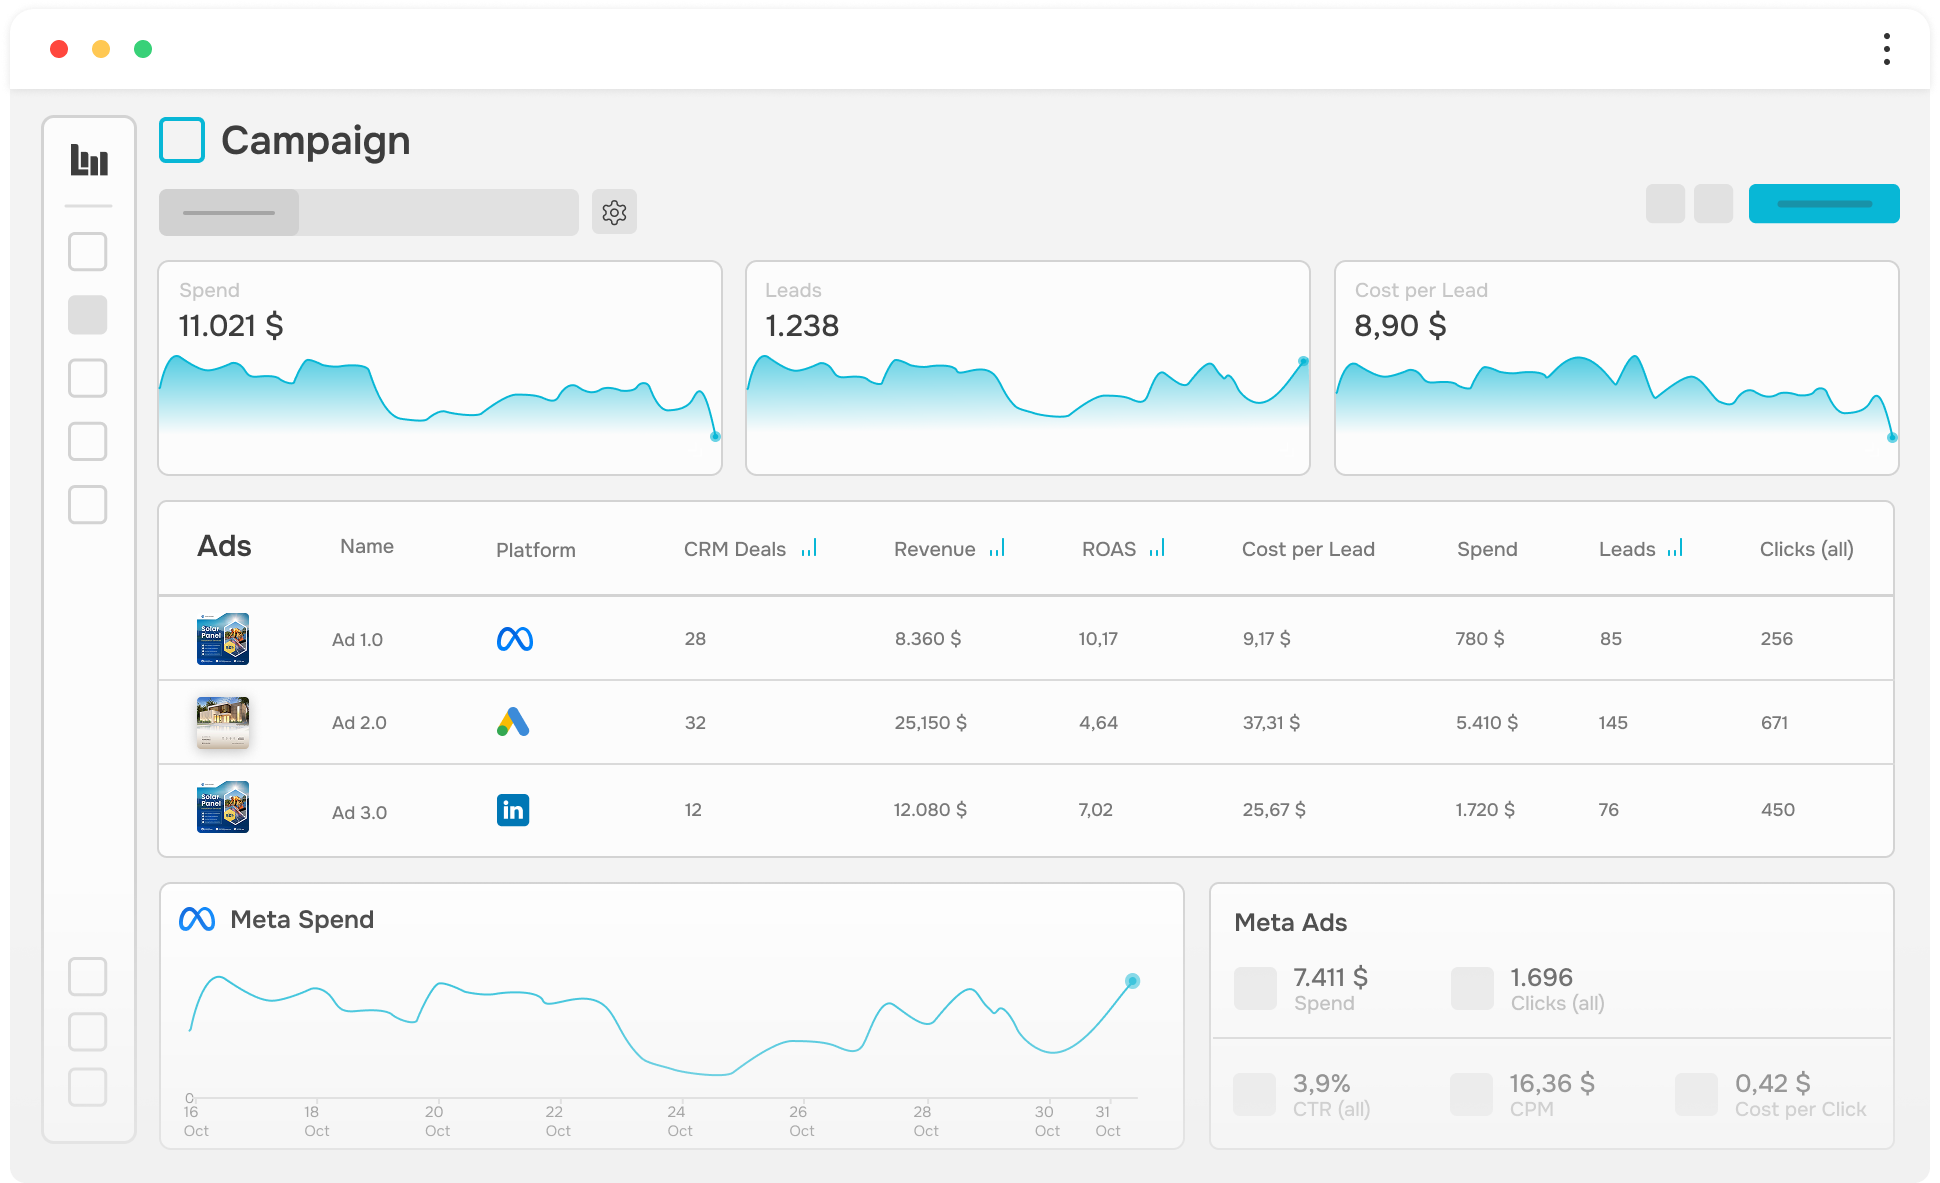 LeadMetrics dashboard showing spend, leads, cost per lead, ROAS per ad as well as CTR, CPM and CPC
- All ad data in one place: LeadMetrics syncs campaigns, ad sets, ads and daily metrics including spend from Meta, Google Ads, TikTok, LinkedIn and Microsoft Ads (Beta).
- Leads with their source: A tracking script matches every lead to its session with traffic source, UTMs and click IDs. Leads from Meta Instant Forms and LinkedIn Lead Forms can be connected as well.
- Real business metrics: Deals from HubSpot and Close and payments from Stripe, CopeCart and Digistore24 are matched to the lead. That gives you cost per lead, cost per deal and ROAS per channel, campaign, ad set and ad – with first-click or last-click attribution instead of each platform's own counting.
- Dashboards: In dashboards you drill down from channel to individual ad and compare up to four ads side by side in the ad analysis.
- Conversion API: Through the Conversion API, LeadMetrics sends events such as lead, purchase or deal won with their value to Meta, Google Ads, TikTok and LinkedIn.
To learn how CRM data becomes real conversions, read From CRM lead to real conversion.
Ready for better tracking?
Frequently asked questions
Terms in this guide
All termsReach
Reach is the number of unique people who saw your ad at least once in a given period – each person is counted only once, no matter how often they saw it.
Impressions
Impressions count how often an ad was displayed in total. If the same person sees it several times, every view counts as a separate impression.
CPM · Cost per Mille
CPM (cost per mille) is the price you pay for 1,000 impressions of an ad: ad spend divided by impressions, multiplied by 1,000.
Engagement Rate
Engagement rate shows what percentage of people or impressions interact with a post or ad – through likes, comments, shares, saves or clicks.
Click-Through Rate
Click-through rate (CTR) is the percentage of people who see an ad and then click on it, calculated as clicks divided by impressions.
Cost per Lead
Cost per lead (CPL) is the average amount you pay to acquire a single lead: ad spend divided by the number of leads generated.
Cost per Acquisition
Cost per acquisition (CPA) measures the average ad spend per conversion such as a purchase or closed deal: ad spend divided by the number of conversions.
ROAS · Return on Ad Spend
ROAS (return on ad spend) measures how much revenue every dollar spent on advertising brings in: revenue from ads divided by ad spend.
Related articles
- From CRM Lead to Real Conversion: No More Flying Blind in Performance MarketingHow CRM/AdSync makes the true value of your campaigns visible – and why it's the game-changer for data-driven growth.
- META Andromeda Update - Tracking ComplicationsMeta (formerly Facebook) has rolled out Andromeda, the largest update to its advertising algorithm to date – fundamentally changing how Facebook Ads and Instagram Ads are delivered. For all marketers, advertisers, and agencies, one thing is now clear: those who don't have conversion tracking under control will lose visibility, revenue, and scalability.
More guides
All guidesMeasure Real ROAS in Lead Generation: From Click to Closed Deal
How to measure real ROAS in lead generation: attribute CRM revenue to campaigns, read CPL, CPA and ROAS correctly and send deal values back to Meta and others.
Read guideCampaign Tracking with UTMs and Click IDs: Setup Guide
Set up clean campaign tracking: a UTM naming convention, dynamic parameters in Meta and Google Ads, click IDs, common mistakes and how to test it all.
Read guide